
![ApptioCareers-Employee[1]](data:image/svg+xml;base64,PHN2ZyB4bWxucz0iaHR0cDovL3d3dy53My5vcmcvMjAwMC9zdmciIHZpZXdCb3g9IjAgMCAyMjUgMjc1IiB3aWR0aD0iMjI1IiBoZWlnaHQ9IjI3NSIgZGF0YS11PSJodHRwcyUzQSUyRiUyRnd3dy5hcHB0aW8uY29tJTJGd3AtY29udGVudCUyRnVwbG9hZHMlMkZlbGVtZW50b3IlMkZ0aHVtYnMlMkZBcHB0aW9DYXJlZXJzLUVtcGxveWVlMS1xZzVuenB5MHdoaWJtbzZvdmJqNGM3MHh0aTUzdmo1OHM0endwajh0dHMucG5nIiBkYXRhLXc9IjIyNSIgZGF0YS1oPSIyNzUiIGRhdGEtYmlwPSIiPjwvc3ZnPg== "ApptioCareers-Employee[1]")
Kubernetes DevOps Tools
Chapter 5: cAdvisor
Like this article?
Subscribe to our LinkedIn newsletter to receive more educational content.
Knowing the resource usage and performance characteristics of your applications is key to their optimization and lifecycle management. Since containerized applications are becoming the norm, there is a need for a reliable and efficient way to gather usage and performance metrics from them, despite their tendency to be heavily distributed.
One way to do this effectively would be to use an agent that collects and exports data directly from the containers themselves. cAdvisor is a tool that does exactly this. During this article, we will demonstrate how to install and best utilize cAdvisor, allowing you to keep track of container resource utilization and performance.
What is cAdvisor?
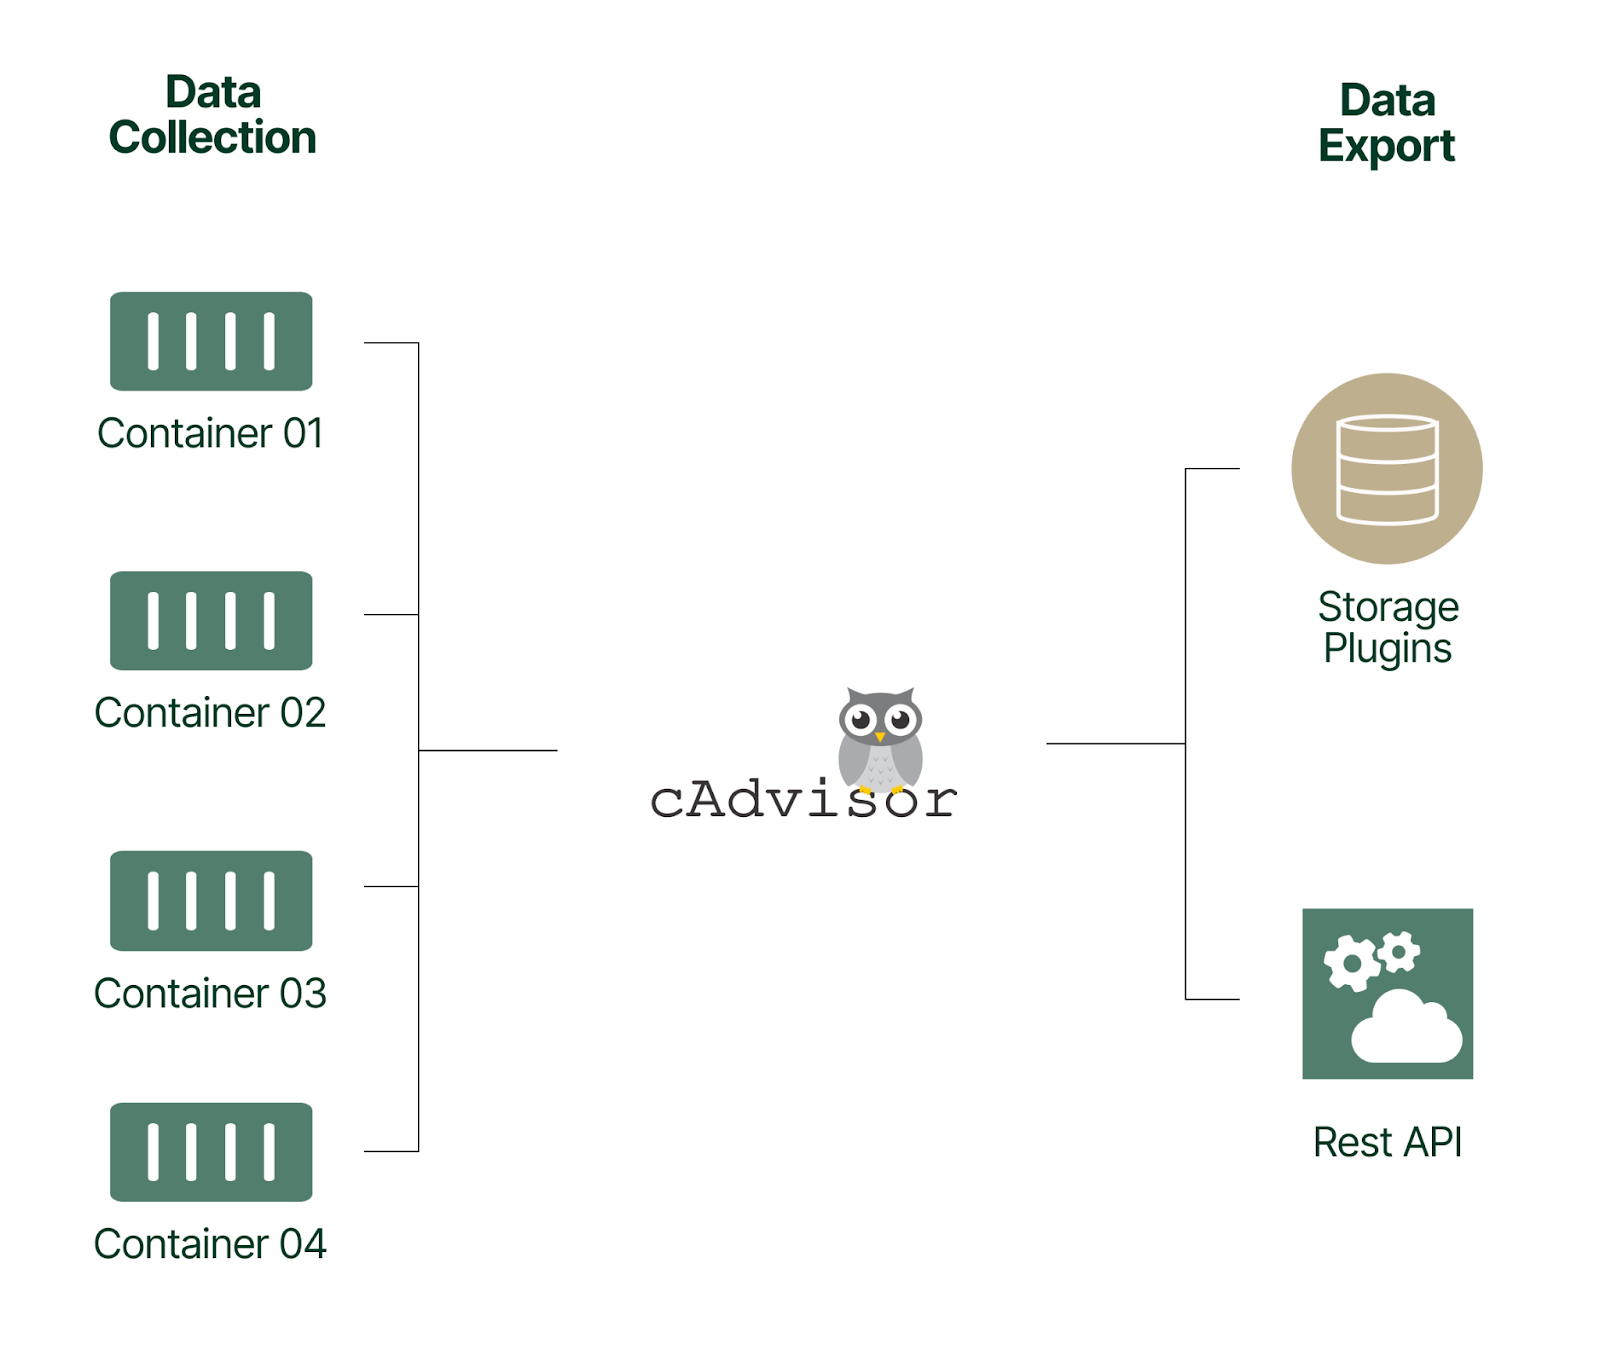
cAdvisor, short for Container Advisor, is an open-source tool developed by Google to monitor containers. It can collect, aggregate, process, and export container-based metrics such as CPU and memory usage, filesystem and network statistics. You can easily use this tool in any containerized environment, ranging from a single Docker installation to a complete Kubernetes cluster. Kubecost uses cAdvisor as part of its core architecture.
Features of cAdvisor
cAdvisor has become one of the leading solutions for monitoring containers because of its user-friendliness, flexibility, and ability to meet almost any monitoring requirement. cAdvisor has the following features:
- Native support for Docker containers and out-of-the-box support for other container types
- Automatically discovers containers within its node and starts collecting data
- Multiple implementation methods, including running as a standalone application at the OS level, a Docker container, or a DaemonSet in Kubernetes
- Can export data to storage plugins such as Prometheus, Elasticsearch, and InfluxDB for further analysis and processing
- Has a built-in Web UI that exposes real-time metrics from collected data
- Ability to provide overall node resource usage by analyzing the root container
- Powerful REST API to query container metrics directly from cAdvisor
Limitations of cAdvisor
While cAdvisor is a powerful and versatile tool, there are some limitations that you should be aware of:
- cAdvisor only collects basic resource utilization information and may not be sufficient if in-depth metrics are needed
- Different OSs will require specific configurations to gather metrics, such as running in privileged mode for RHEL and CentOS, or enabling memory cgroups in Debian
- Collecting metrics for custom hardware like GPUs requires additional configuration, which will differ depending on the underlying infrastructure
- cAdvisor does not provide a method to modify runtime options after initial configuration. Users will need to redeploy the cAdvisor container with the new runtime options if this is required
- cAdvisor requires external tooling to to store collected data long-term and to run any further analytics

How to implement cAdvisor
Now we have a better understanding of cAdvisor, let’s look at some different implementation methods.
Implement cAdvisor as a container
This is the simplest method to get cAdvisor up and running. Here, users deploy the cAdvisor image and run it as an independent container in a Docker installation.
The cAdvisor container image is available via Google here, and anyone can pull the image to create a running cAdvisor container. Our example below uses Docker 20.10.14 in an Ubuntu 20.04.1 environment.
Run the following command to create a cAdvisor container in Docker:
					sudo docker run \
  --volume=/:/rootfs:ro \
  --volume=/var/run:/var/run:rw \
  --volume=/sys:/sys:ro \
  --volume=/var/lib/docker/:/var/lib/docker:ro \
  --publish=8080:8080 \
  --detach=true \
  --name=cadvisor \
  gcr.io/cadvisor/cadvisor:v0.39.3
The result will look like this:
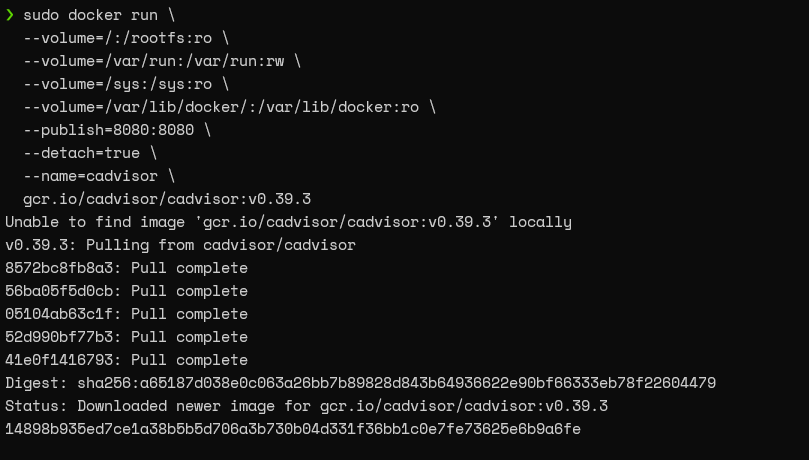
Note: Ensure that the correct cAdvisor version is referenced as the container image.
The cAdvisor container is now running and will begin collecting metrics. Users can access its web interface via port 8080.
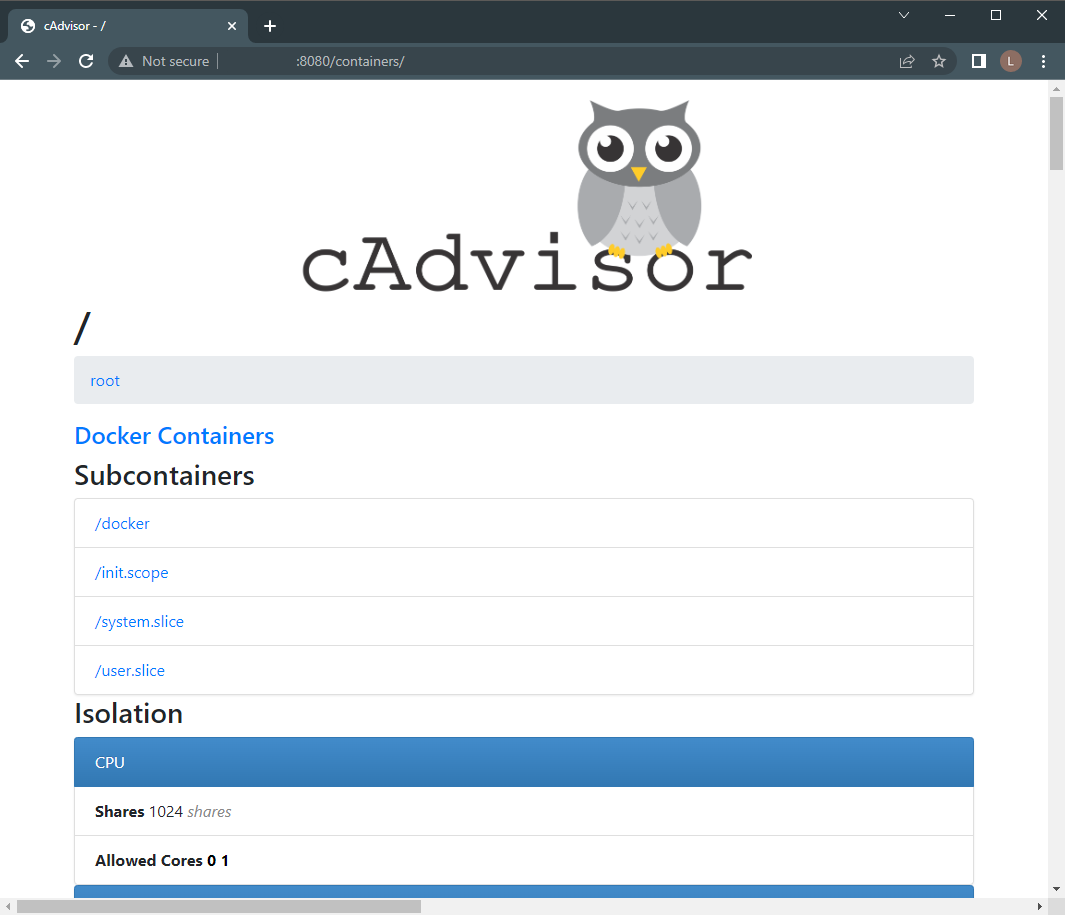
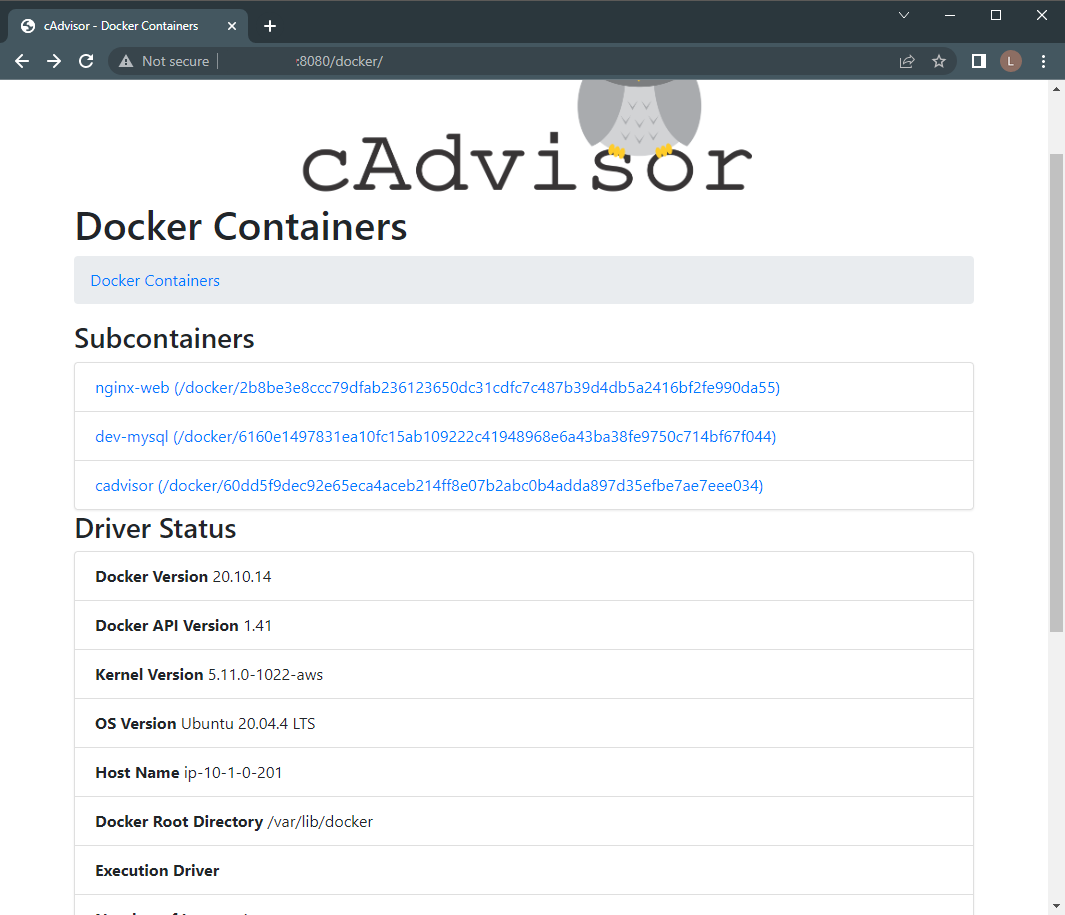
You can view individual containers and obtain individual metrics, by selecting the Docker Containers link.
Implement cAdvisor as a standalone application
cAdvisor can also run directly in a host machine. Download the package from the GitHub release page here and run it on your host machine. No installation or configuration is required—it just requires the following commands:
					wget https://github.com/google/cadvisor/releases/download/v0.39.3/cadvisor
chmod +x cadvisor
sudo ./cadvisor

As before, users can access the cAdvisor interface via port 8080.
Note: in this case a cAdvisor container will not exist as it is running as a standalone application outside of Docker.
When running as a standalone application, cAdvisor will typically need root privileges. This is because accessing certain system data requires elevated permissions. Usefully, cAdvisor will gracefully degrade its features to match the available data sources that it’s allowed to access.
Implement cAdvisor in Kubernetes
cAdvisor can also be deployed in Kubernetes. A typical Kubernetes cluster consists of many nodes and cAdvisor should be installed on all of them to be able to export metrics from your containers successfully.
Manually installing cAdvisor into each cluster node is typically not feasible due to scale. Instead, make use of a Kubernetes DaemonSet, which will automatically deploy an instance of a given container to every node for you.
Installing cAdvisor as a DaemonSet
cAdvisor provides support for Kustomize. Kustomize allows users to easily customize and install cAdvisor as a DeamonSet in any Kubernetes cluster. Our example demonstrates this using a minkube 1.25.2 K8s cluster and Kustomize 4.5.4.
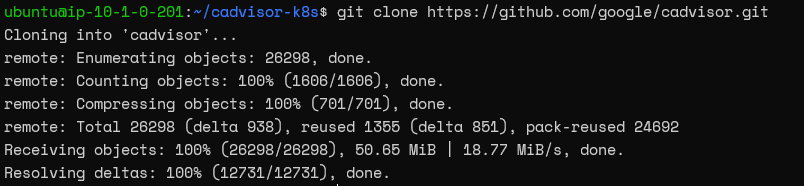
Download the Kustomize files from the git repository.
git clone https://github.com/google/cadvisor.git
Navigate to the deploy/kubernetes folder and change the configuration to reflect the desired cAdvisor version. This can be done using the following commands:
					VERSION=v0.39.3
cd deploy/kubernetes/base && ./kustomize edit set image
gcr.io/cadvisor/cadvisor:${VERSION} && cd ../../..
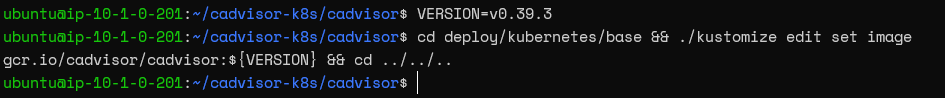
Note: Ensure you are pointing to the kustomize executable, located in your system.
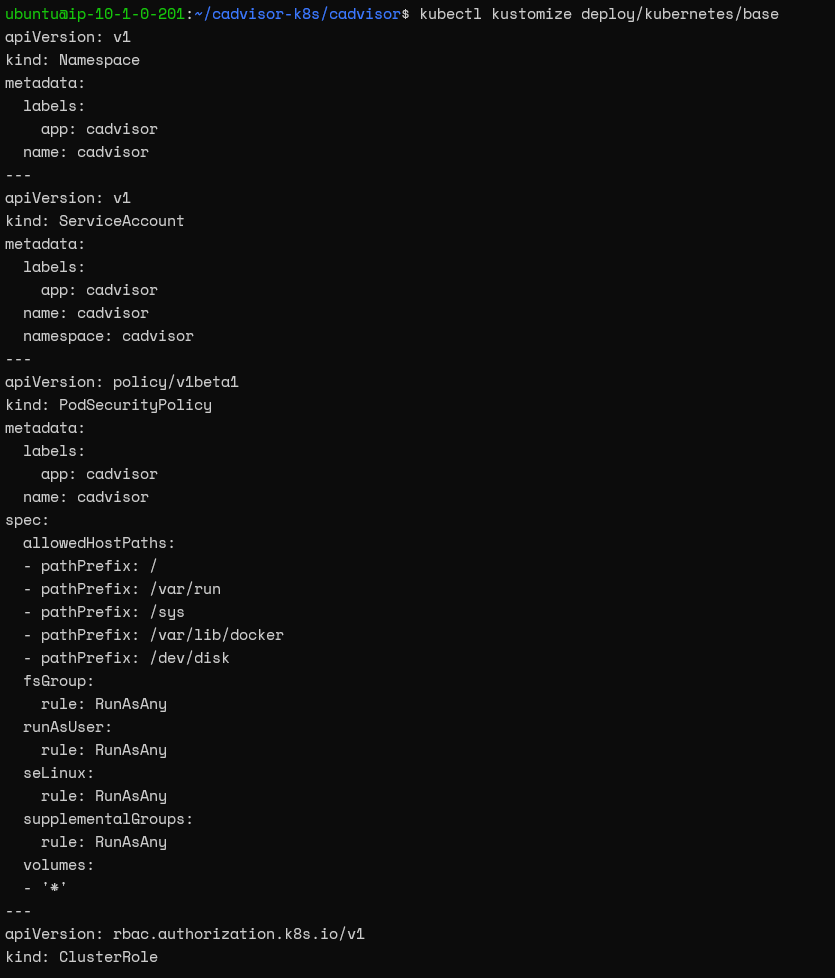
Generate the base DaemonSet. During this step, users can verify the generated DaemonSet and ensure that the required configurations are created.
kubectl kustomize deploy/kubernetes/base
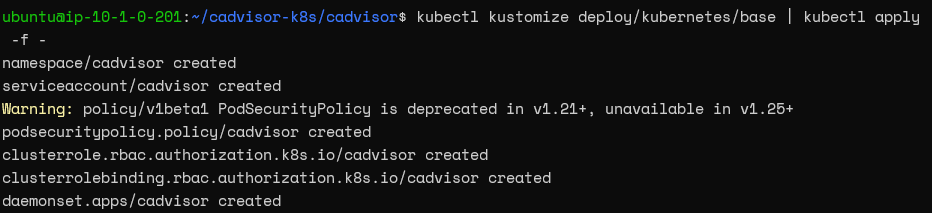
Apply the DeamonSet to the Kubernetes cluster.
kubectl kustomize deploy/kubernetes/base | kubectl apply -f -
Verify the DeamonSet by running the ‘kubectl get’ command within the cAdvisor namespace and note the newly created resources.
kubectl get all -n cadvisor
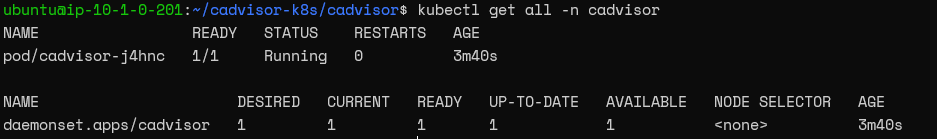
That’s it, you have deployed cAdvisor as a DeamonSet using Kustomize!
Custom cAdvisor configuration
You don’t have to use Kustomize to deploy cAdvisor on Kubernetes. If you prefer, you can create your own DaemonSet YAML manifest instead. The following example cadvisor.yml will deploy cAdvisor directly to the cluster without requiring Kustomize.
					apiVersion: apps/v1
kind: DaemonSet
metadata:
  name: cadvisor
  namespace: kube-system
  labels:
    k8s-app: cadvisor-monitoring
spec:
  selector:
    matchLabels:
      name: cadvisor
  template:
    metadata:
      labels:
        name: cadvisor
    spec:
      tolerations:
      - key: node-role.kubernetes.io/master
        effect: NoSchedule
      containers:
      - name: cadvisor
        image: gcr.io/cadvisor/cadvisor:v0.39.3
        volumeMounts:
        - name: rootfs
          mountPath: /rootfs
          readOnly: true
        - name: var-run
          mountPath: /var/run
          readOnly: false
        - name: sys
          mountPath: /sys
          readOnly: true
        - name: docker
          mountPath: /var/lib/docker
          readOnly: true
        ports:
          - name: http
            containerPort: 8080
            protocol: TCP
        args:
          - --profiling
          - --housekeeping_interval=1s
      terminationGracePeriodSeconds: 30
      volumes:
      - name: rootfs
        hostPath:
          path: /
      - name: var-run
        hostPath:
          path: /var/run
      - name: sys
        hostPath:
          path: /sys
      - name: docker
        hostPath:
          path: /var/lib/docker
Users can implement this DaemonSet in any Kubernetes cluster using ‘kubetctl apply’.
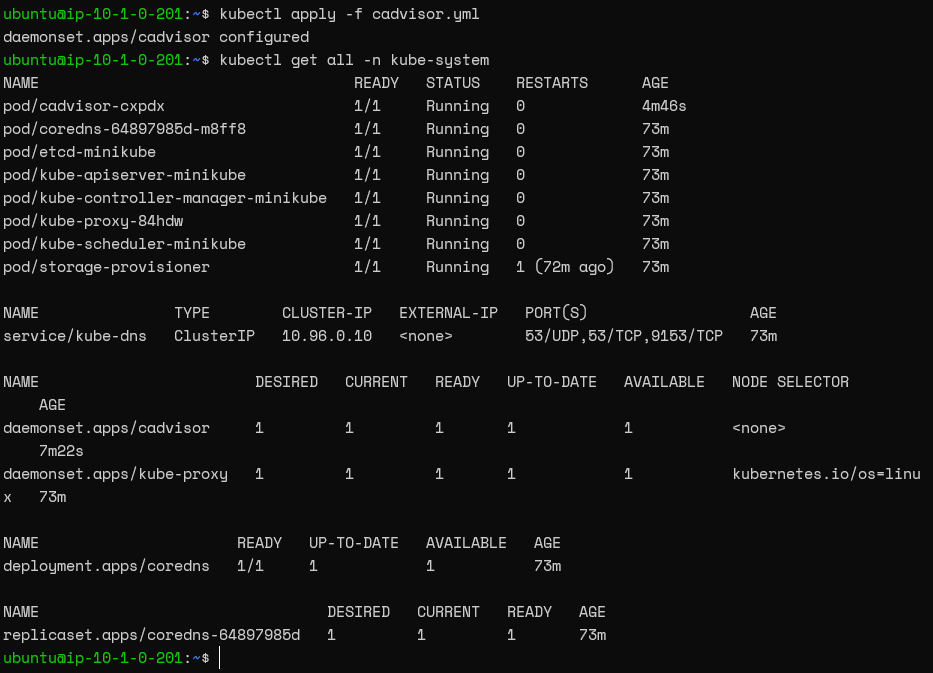
Note: Depending on the requirement, provide the necessary runtime arguments to modify the behavior of cAdvisor.
Advisor runtime options
Now we know how to configure cAdvisor for different environments, let’s see how to modify its behavior. The runtime options provided by cAdvisor enable users to change the defaults to meet different monitoring requirements. Here are some useful ones organized in a handy table.
Table 1 – cAdvisor Runtime Options
| Runtime Option | Usage |
|---|---|
| --store_container_labels=false | stops converting container labels and environment variables |
| --docker_only=false | stops reporting raw cgroup metrics except for the root cgroup |
| --enable_load_reader=false | Enable CPU load reader |
| --profiling=true | enable profiling via the Web interface |
| --log_cadvisor_usage=true | enable cAdvisor container usage logs |
| --allow_dynamic_housekeeping=true | enable dynamic housekeeping interval |
| --global_housekeeping_interval | set the housekeeping interval at a global or per container level. This ensures that periodic housekeeping tasks are carried out at these specified intervals. |
| --housekeeping_interval | |
| --http_auth_file= | authentication file for the Web UI |
| --storage_driver | storage driver to be used for persistent data storage |
| --disable_metrics / --enable_metrics | enable and disable specific metrics |
Export data using cAdvisor
As mentioned earlier, cAdvisor is not a tool that can store data long-term or perform analytics. However, it can export collected data into different supported storage backends, including ElasticSearch, Prometheus, BigQuery, and InfluxDB.
In this example, we will configure cAdvisor to export data to an Elasticsearch cluster. Use the following command, with the runtime options pointing to Elasticsearch, to create the cAdvisor container.
sudo docker run \
  --volume=/:/rootfs:ro \
  --volume=/var/run:/var/run:rw \
  --volume=/sys:/sys:ro \
  --volume=/var/lib/docker/:/var/lib/docker:ro \
  --publish=8080:8080 \
  --detach=true \
  --name=cadvisor \
  gcr.io/cadvisor/cadvisor:v0.39.3 -storage_driver=elasticsearch -storage_driver_es_host="http://10.10.10.100:9200" -storage_driver_es_type="stats"
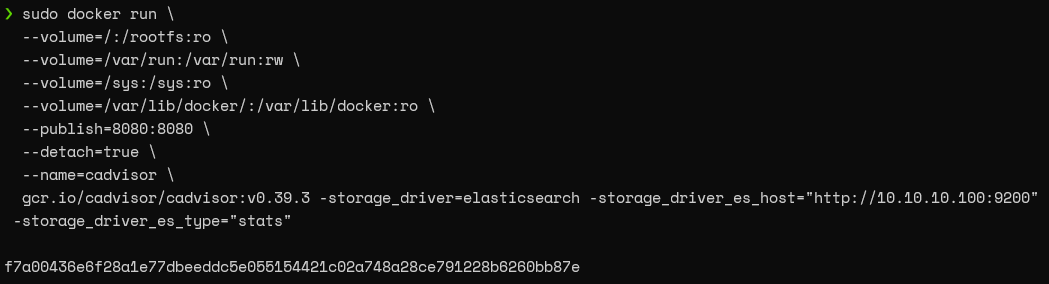
In the runtime commands, the storage_driver points to the storage plugin, the storage_driver_es_host points to the Elasticsearch cluster and the storage_driver_es_type option defines the Elasticsearch type name. See here for details. Users can exchange the runtime options for storage-plugin specific ones to configure different backends.
Best practices when using cAdvisor
cAdvisor gives you the ability to capture data from containers. However, if not properly configured and optimized, cAdvisor could potentially decrease the performance of your applications by increasing resource consumption. Here are some best practices to minimize performance problems:
- Running the default cAdvisor configuration can cause high CPU usage. To avoid this, you can configure runtime options that specifically define the data that cAdvisor should capture, and how oftenv
- housekeeping_interval: setting this to a value of 30 seconds ensures that periodic actions to gather container stats run at a set interval
- docker_only: setting this to true means it reports raw cgroup metrics
- disable_metrics: disable all unused metrics individually. This minimizes total load as it reduces the metrics that cAdvisor queries
- configure a storage plugin when implementing cAdvisor. This allows you to store the collected data from the start. It’s always recommended to use a storage plugin when implementing cAdvisor unless in a development environment
- cAdvisor requires adequate resources to function and you should ensure that there is enough headroom in the containerized environment to account for this. In a Kubernetes cluster, with cAdvisor deployed as a DemonSet, the resource requirements will depend on the number of Pods within each node and what data is being queried. The more pods that data are collected from, the more resources are required to process and export that data.
- With the introduction of the Metrics API and Metrics Server in Kubernetes, most of the data collected from cAdvisor can be queried natively through Kubernetes itself. You should therefore not overlap data collected through cAdvisor and any other Kubernetes tool.
Conclusion
cAdvisor a simple yet powerful tool, capable of extracting resource usage and performance characteristics from containers. Its support for many platforms, ranging from local Docker installations to fully-fledged orchestration platforms like Kubernetes, allows you to adapt cAdvisor to most monitoring needs. When combined with plugins that export data to tools like Prometheus and Elasticsearch, cAdvisor becomes one of the most versatile metric collection solutions available.
